In the previous blog posts we have discussed the Model-View-Intent (MVI) pattern and it’s characteristics. In part 1 we have talked about the importance of an unidirectional data flow and application state that is driven by the “business logic”. In this blog post we will see how this pays off when it comes to debugging to simplify the life of developers.
Have you ever got a crash report and you were not able to reproduce the bug? Sounds familiar? For me too! After having spend many hours looking at the stacktrace and our source code I gave up and have closed such issues in our issue tracker with a little comment like “can’t reproduce it” or “must be a strange device / manufacturer specific bug”.
Concrete example from our shopping cart app we have developed in this blog post series: On the home screen the user of our app can do a pull-to-refresh and somehow, as the crash reports states, there is a NullPointerException thrown while loading the newest data triggered by pull-to-refresh.
So you as developer start the app and do a pull-to-refresh on the home screen but the app is not crashing. It’s working as expected. So you take a closer look at your code but you can’t see how a NullPointerException could be thrown there. You attach a debugger, go step by step through the code of the involved components, but still: it is working properly. How the hell can this app crash on a pull-to-refresh?
The problem is that you can’t reproduce the state before the crash happened. Wouldn’t it be nice if the user who had the crash could give you his app state (before the crash happened) along with the stacktrace in the crash report? With unidirectional data flow and Model-View-Intent this is super easy. We simply log all intents the user triggers and the model (model reflects the app state, a.k.a. view state) that is rendered on the view. Let’s do that for the home screen by adding logs in the HomePresenter (for more details about this class see part 3 where we have discussed the advantages of a state reducer). In the following code snippets we use Crashlytics but it should be possible to do the same with any other crash reporting tool.
class HomePresenter extends MviBasePresenter<HomeView, HomeViewState> {

  private final HomeViewState initialState; // Show loading indicator

  public HomePresenter(HomeViewState initialState){
    this.initialState = initialState;
  }

  @Override protected void bindIntents() {

    Observable<PartialState> loadFirstPage = intent(HomeView::loadFirstPageIntent)
          .doOnNext(intent -> Crashlytics.log("Intent: load first page"))
          .flatmap(...); // business logic calls to load data

    Observable<PartialState> pullToRefresh = intent(HomeView::pullToRefreshIntent)
          .doOnNext(intent -> Crashlytics.log("Intent: pull-to-refresh"))
          .flatmap(...); // business logic calls to load data

    Observable<PartialState> nextPage = intent(HomeView::loadNextPageIntent)
          .doOnNext(intent -> Crashlytics.log("Intent: load next page"))
          .flatmap(...); // business logic calls to load data

    Observable<PartialState> allIntents = Observable.merge(loadFirstPage, pullToRefresh, nextPage);
    Observable<HomeViewState> stateObservable = allIntents
          .scan(initialState, this::viewStateReducer) // call the state reducer
          .doOnNext(newViewState -> Crashlytics.log( "State: "+gson.toJson(newViewState) ));

    subscribeViewState(stateObservable, HomeView::render); // display new state
  }

  private HomeViewState viewStateReducer(HomeViewState previousState, PartialState changes){
    ...
  }
}
We simply add logging with RxJava’s .doOnNext() operator for every intent and to the “result” of each intent, the view state, which then will be rendered on the view. We serialize the view state as json (we will talk about that in a minute).
Now our crash report looks like this:
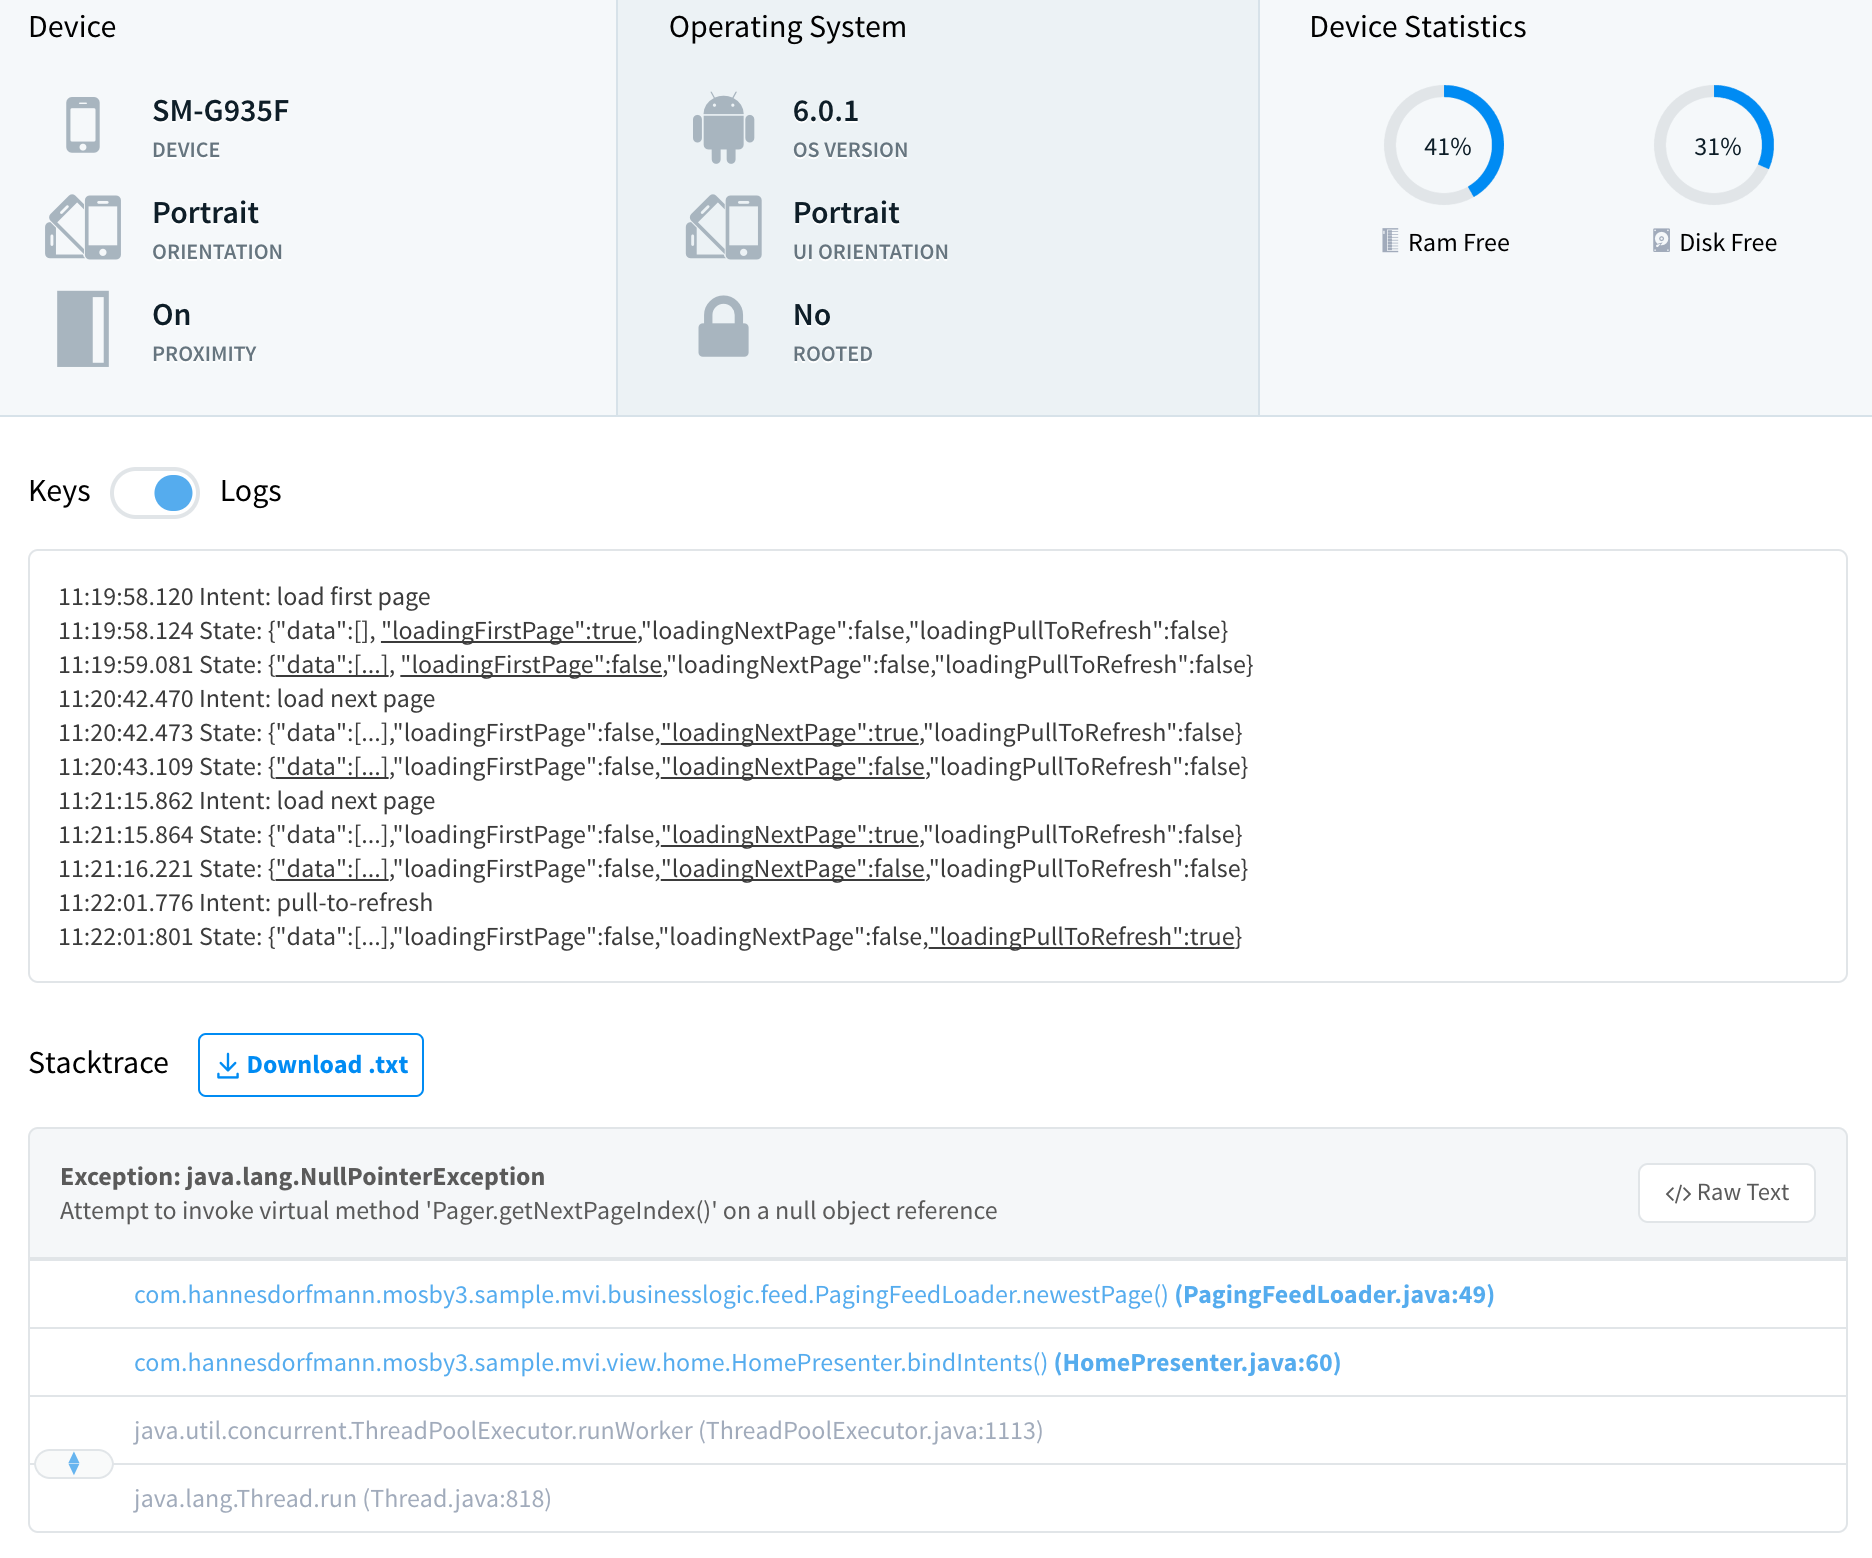
Take a look at the logs: Not only we see the latest state before the crash happened but we see the full history how the user reached this state. For better readability I have underlined the state transitions and replaced the “data” field (the items that are displayed in the recycler view) with […] . So the user started the app - load first page intent. Then the loading indicator is displayed “loadingFirstPage”:true and then the data has been loaded (data[…]). Next the user scrolled through the list of items and reached the end of the RecyclerView which triggers a load next page intent to load more data (pagination), which causes a state transition to “loadingNextPage”:true. Once the next page is loaded the data (data[…]) has been updated and “loadingNextPage”:false has been set properly. The user did the same (scroll down the RecyclerView and trigger a load next page intent) for a second time. And then he started a pull-to-refresh intent and the state transitions to “loadingPullToRefresh”:true. Suddenly the app crashes (no more logs afterwards).
So how does that information helps us to fix that bug? Obviously, we know which intents the user triggered, so we can do that manually to reproduce the bug. Moreover, we have snapshots of our app’s state (over time) as json. We can simply take the last state, deserialize the json and take this state as our initial state to fix that bug:
String json ="  {\"data\":[...],\"loadingFirstPage\":false,\"loadingNextPage\":false,\"loadingPullToRefresh\":false} ";
HomeViewState stateBeforeCrash = gson.fromJson(json, HomeViewState.class);
HomePresenter homePresenter = new HomePresenter(stateBeforeCrash);
Then we attach a debugger and trigger the pull-to-refresh intent. It turns out that if the user has scrolled down the page 2 times no more data is available and our app didn’t handled that fact properly, so that a following pull-to-refresh causes the crash.
Conclusion
Making app’s state “snapshotable” makes the life of us developers much easier. Not only that we are able to reproduce crashes easily, furthermore, we can take the serialized state to write regression tests with almost zero extra costs. Keep in mind that this is only possible if the app’s state follows the principle of an unidirectional data flow (driven by the business logic), immutability and pure functions. Model-View-Intent pushes us into that direction so that building “snapshotable” apps is a nice and useful side effect of this architecture.
What are the downsides of “snapshotable” apps? Obviously we are serializing the apps state (i.e. with Gson). This adds some extra computation time. In an average sized app of mine this takes about 30 milliseconds for the first time the state gets serialized with Gson because Gson has to scan the classes by using reflections to determine the fields that have to be serialized. Consecutive state serialization takes about 6 milliseconds on average on a Nexus 4. Since serialization runs in .doOnNext() this typically runs on a background thread, but yes, a user of my app has to wait 6 milliseconds more than without snapshotting to see the new state on the screen. From my point of view that is not noticeable by an apps user. However, an issue with snapshotting the state is that on a crash the amount of data uploaded from the users device by the crash reporting tool to his server is significant bigger. No big deal if the user is connected over wifi, but could be an issue for the users mobile data plan. Last but not least, you may leak sensitive user data when attaching the state to a crash report. Either don’t serialize sensitive data which may cause that the state attached to the crash report is not complete (and therefore almost useless) or encrypt sensitive data (which may requires some extra cpu time).
To sum it up: I personally see a lot of advantages in snapshotting my app, however, you may have to make some tradeoffs. Maybe you start to enable snapshotting your app for your internal builds or beta builds to see how it works out for your app.
Bonus: Time Traveling
Wouldn’t it be nice to have some kind of “time traveling” option during development. Maybe embedded in a debug-drawer like the one of Jake Wharton’s u2020 demo app:
All we need in such a debug-drawer are two buttons “previous state” and “next state” so that we can step by step travel back in time from one state to previous (or next) state. Obviously that requires some additional setup then just snapshotting our app’s state. For example: if we have made a HTTP request as part of a state transition we certainly don’t want to make the real HTTP request again while time traveling because data on backend side might have changed in the mean time.
Time traveling requires some kind of extra layer like a proxy at the boundary of an app so that we can “record” and “replay” things like http requests (same for sqlite database etc.). Interested in something like that? It seems that my friend Felipe is working on something like that for OkHttp. Feel free to ping him to get more details about the library he is currently working on.
Would you find useful an Android library that can record and replay OkHttp network interaction for, say Espresso tests?
— lima.eth (@felipecsl) February 28, 2017
This is a post in the Reactive Apps with Model-View-Intent series.
Other posts in this series:
- Reactive Apps with Model-View-Intent - Part 1: Model
- Reactive Apps with Model-View-Intent - Part 2: View and Intent
- Reactive Apps with Model-View-Intent - Part 3: State Reducer
- Reactive Apps with Model-View-Intent - Part 4: Independent UI Components
- Reactive Apps with Model-View-Intent - Part 5: Debugging with ease
- Reactive Apps with Model-View-Intent - Part 6: Restoring State
- Reactive Apps with Model-View-Intent - Part 7: Timing (SingleLiveEvent problem)
- Reactive Apps with Model-View-Intent - Part 8: Navigation